Project time: 2018 – 2019
I present a captivating project that showcases my proficiency in data visualization and data analysis, using cutting-edge tools like D3.js to create an engaging and informative user experience.
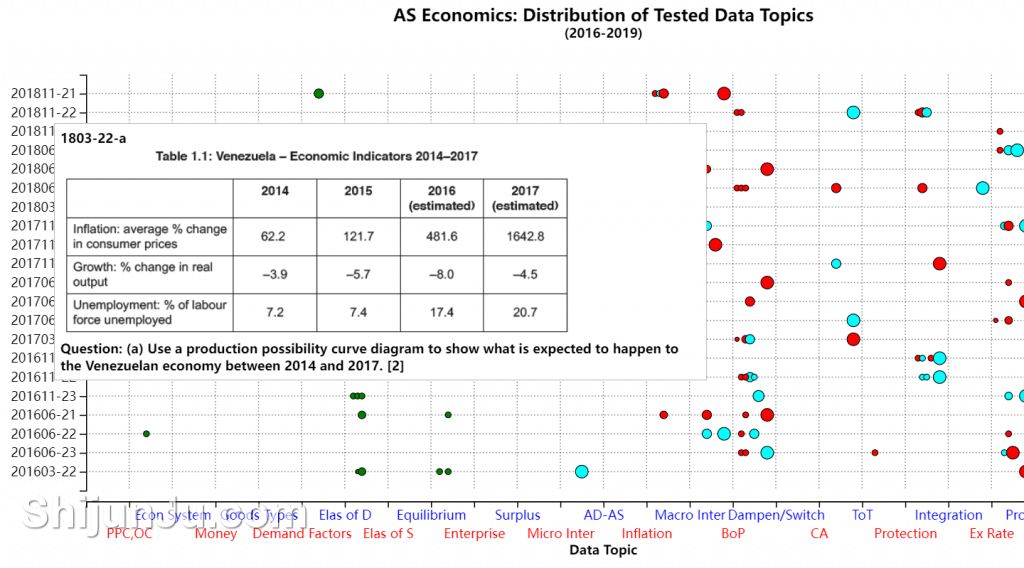
- Organized Exam Question Repository: One of my notable projects involved organizing a repository of past exam questions. I meticulously categorized these questions by topic, marking scheme, level of difficulty, and year of examination. This systematic organization not only simplifies access to historical exam questions but also provides valuable insights into question patterns and trends over time.
- Interactive D3.js Visualization: To make this resource even more valuable, I harnessed the power of D3.js, a powerful data visualization library. Using D3.js, I created an interactive visualization that allows users to explore and interact with the exam questions effortlessly. Users can hover over questions to reveal contextual information, including the question itself and its corresponding answer. This feature enhances the learning experience by providing immediate feedback and context.
- Data-Driven Insights: Behind the scenes, my work involved data analysis to uncover patterns and trends within the exam questions. I leveraged data science techniques to identify recurring topics, gauge the difficulty levels, and track changes in the format of questions over the years. These insights are valuable for educators, students, and exam preparation.
- User-Focused Design: Throughout the project, I prioritized user experience and usability. The user-friendly interface ensures that anyone, from students to educators, can efficiently navigate the wealth of exam questions, making it a valuable resource for exam preparation and curriculum planning.


