Project Time: 2015-2018
I have a diverse collection of teaching graphs spanning subjects such as Economics, Physics, and Mathematics. These visuals were created with the goal of helping students grasp abstract concepts more easily. By effectively utilizing data visualization techniques, I made complex topics more accessible and engaging for learners.
Mathematics Graphs for Complex Geometrics:
- Within my portfolio, you'll find a range of mathematical graphs, created using LaTeX, that demonstrate intricate 3D geometric concepts, including vectors and calculus. These visualizations showcase my proficiency in handling complex mathematical data and presenting it in an intuitive and comprehensible manner.

Economic Graphs for Dynamic Models:
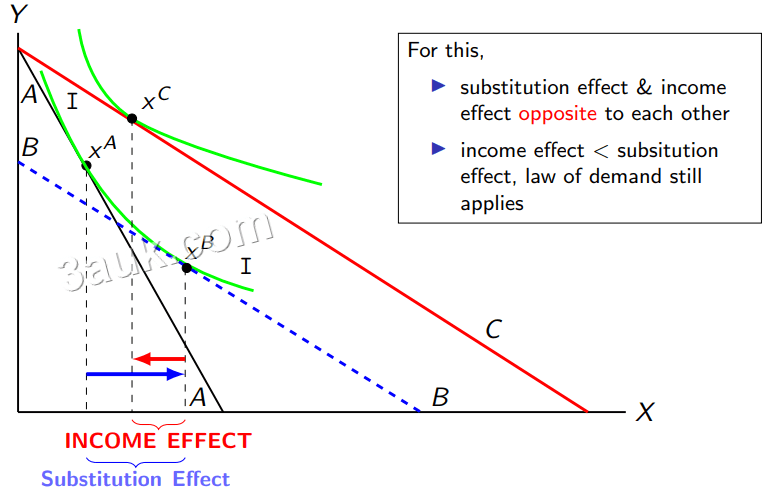
- My portfolio includes a series of economic graphs, created using R and LaTeX, that illustrate dynamic economic models. These models cover various aspects, such as depicting how income circulates in an economy through the circular flow of income model, explaining the transition from short-run to long-run equilibrium in perfect competition, and providing step-by-step analysis of concepts like indifference curve analysis and bilateral bargaining in wage theory. These visuals highlight my ability to analyze and convey economic data effectively.

Physics Graphs for Complex Models and Structures:
- In the physics section of my portfolio, you will find a collection of graphs, created using LaTeX, that elucidate complex models, concepts, and structures. These include visual representations of atomic structures in nuclear physics, graphical analyses of variables in Young's double-slit experiment, and insights into phenomena like diffraction grating in wave theory. My work in this area demonstrates my aptitude for visualizing and explaining intricate physical principles through data analysis and visualization.